
The Markets Are NOT Random!
The markets are random…
Trading is a socially acceptable form of gambling…
You can’t time the markets…
Three of the most destructive false beliefs that many have about the world’s financial markets.
I am going to DESTROY THEM ALL in this article!
These false claims discount the evidence of my life’s work…
I started trading full time in 1997, and since then have been watching the markets on a daily basis…
Assume 200 trading days per year, since I take time off and travel…
That’s 3,800 trading days.
There are 6.5 hours from 9:30am when the stock markets open, to 4:00pm when they close…
That means that I have spent over 24,700 hours looking at price action in the stock market alone!
Add in futures, options, and foreign exchange and you have one huge data set of experience and PROOF…
The markets and the price charts I use to make my investing decisions are the visual manifestation of human group behavior.
Individual humans can be unpredictable and hard to keep ahead of…
However…
If you put all those humans into a group, everything changes.
And the seeming chaos turns into order…
Let me show you how this works…
And challenge you with this thought…
What if all the “bad markets” and “surprise moves” were in fact easy to forecast if you just had the proper insight into what analysis to perform?
What if you were one step away from CLARITY?
You would no longer feel beat up by the market…
You would no longer cringe when you make an investment, as you wonder to yourself…
”Is this going to pay me or hurt me yet again???”
You would no longer sigh and say…
“I hope this one works out.”
With the right information, you would KNOW what the market is doing, and most importantly…
WHY it is doing what it is doing.
Let’s start with a pretty random and chaotic looking price chart…
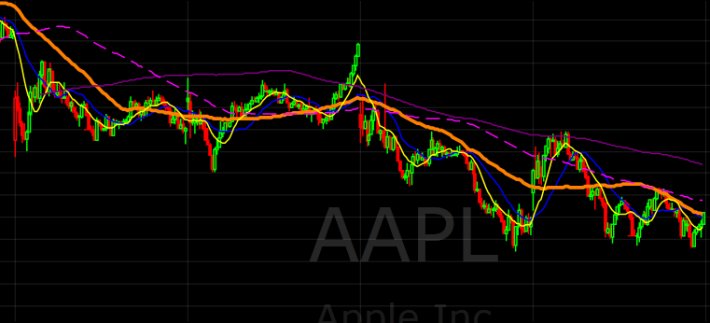
It looks like a mess…
How could we get any opportunity out of this chaos?
Ahh…
But remember…
“What we call chaos is just patterns we haven’t recognized.”
Let’s use some of the most basic price analysis on this chart and see what reliable, repeatable patterns we can find once we start looking.
The tools I will use could be applied with a few colored pencils on any chart you print out.
I’ll start with basic chart support and resistance.
This is based on the principle that markets reverse for a reason.
If price rallies up to test $43.39 per share, and then a reversal forms…
It can ONLY mean that there were enough sellers in that area (for whatever reason) to totally satisfy all the buyers demand.
And logically if all the people who wanted to buy have been satisfied, then there can only be sellers left…
Right?
And…
If we have a market that is dominated by sellers…
Then logically the supply/demand balance would be out of whack…
And we could expect to see the market reverse and start dropping as the sellers are forced to chase the few buyers that there are by offering them a “cheap” or lower price.
Drawing out chart support or resistance levels is as simple as finding the important highs and lows from the past…
Then, drawing a horizontal line from those points…
So that you can keep track of those price levels and see if the markets react to them in the future.
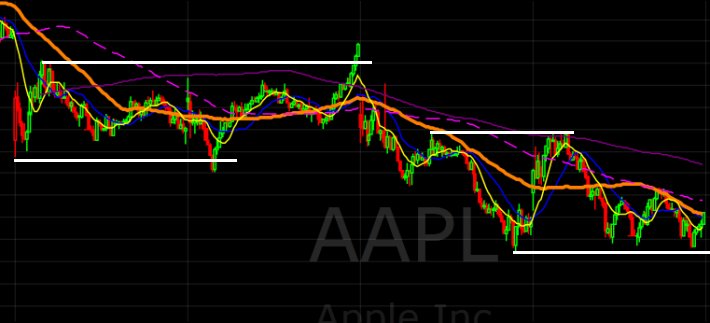
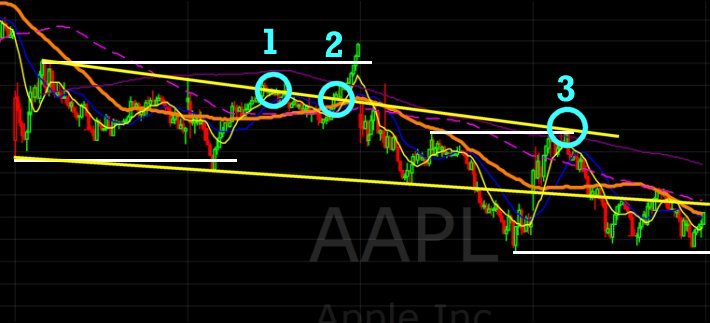
Now, with just 4 lines drawn on this chart, we start to see order emerge from the chaos….
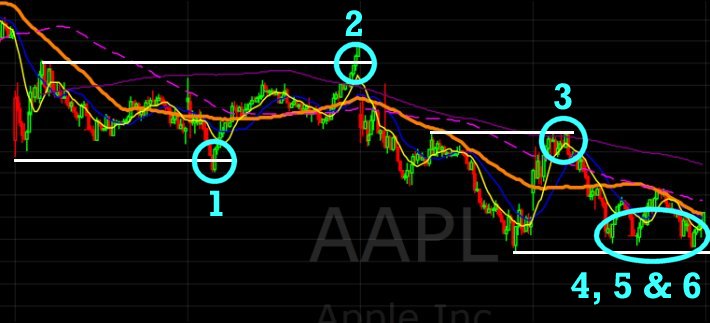
When price drops down to test the support level I identified at the far left side of the chart, (1) the buyers are still lurking in that area in great enough numbers to reverse the price trend in the short term…
This reversal triggers a buying cycle which exhausts itself into the resistance level I identified earlier (2).
This resistance reverses price and although the price decline is halted for a brief time at the prior support level...
The “bounce” or minor rally in price at this former support level lasted long enough to help me define a new resistance level which I drew, thus offering a new “ceiling” for price if it is tested in the future.
When a level of support or resistance is tested multiple times, it tends to soak up the orders that created the area in the first place…
If in this case, the sellers are too strong then the buyers will be overwhelmed and that support now breaks
Price continues to fall until a new support level is defined…
Once that low is established, we see that the price reversal has enough momentum (In our business we call this momentum “power”) to rally back up to test the newly defined resistance line (3)…
This resistance is strong enough to reverse price, and we get yet another predictable, reliable reversal back down.
When price has declined to re-test support, it does so not once…
Not twice…
But three times!
This tells us something very important about this point in the market…
There are a lot of bullish AND bearish players all fighting for dominance.
If the support was strong enough to fend off the sellers multiple times, it may mean that this market is about to be hit by an aggressive wave of buying….
This offers a buying opportunity.
If the support is broken, it would prove that the sellers are strong and passionate enough to overwhelm the crowd of buyers and this aggressive selling is thus likely to continue into the future…
This offers a selling opportunity!
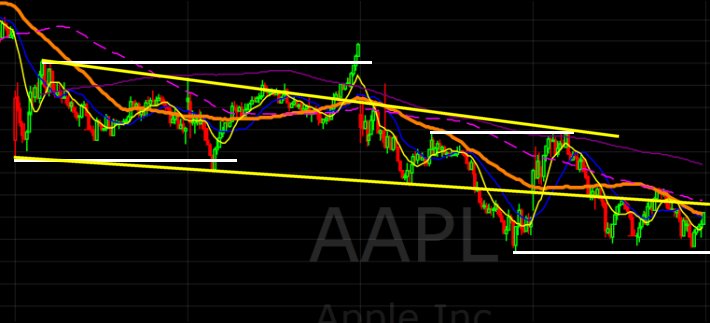
The next tool we will use is called a “trend-line”…
You identify important highs and lows, and then draw a line connecting the two and thus projecting an area of support or resistance into the future…
The basic opportunities that tests of support or resistance offer are two fold…
If the area holds and price reverses...
You can enter and expect to capture profits as price moves away from the rejection zone.
If the area is broken…
You can enter in the direction of the break (breakout or breakdown) and expect to capture profits as price moves in the direction of the break.
The first test of trend line resistance reverses price (1) and offers some profits to the downside…
The second test of trend line resistance (2) has enough power to create a breakout, and offers some profits to the upside…
The third test of this same trend line happens a lot later, but the line still provokes a response (3) as price reverses and offers some profits to the downside.
(You can make money with equal ease when prices fall through the use of “shorting”)
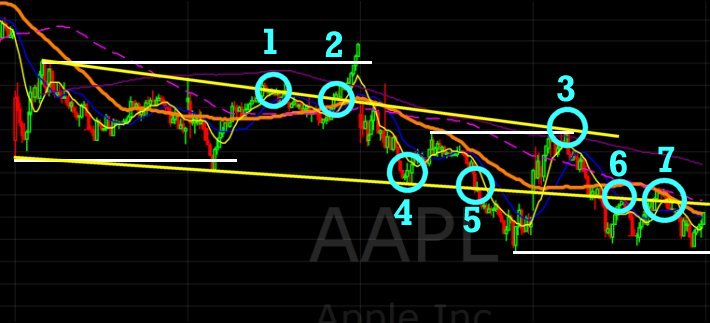
Once the lower trend line is established, price first offers a reversal opportunity, (4) then a breakdown a bit later on (5).
Notice how long this trend remains useful…
Even much later, the line acts as resistance at points (6) and (7).
So…
Do you still believe the market is random???
So far we have identified over 13 objectively identified trading opportunities using nothing more sophisticated than a pencil and a ruler to predict price action…
Now let’s take things a step further…
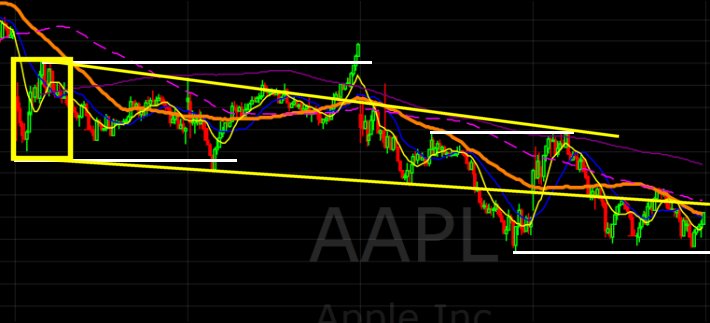
I have drawn a yellow box on the chart in order to measure the size of the price wave after support was tested…
Now, if the markets are random, you wouldn’t expect that this box has any significance…
Would you?
Yet…
If I copy and paste that box over the next price rally off the same support level, what do we see?
The two rallies off the same support level reversed within a few pennies of each other!
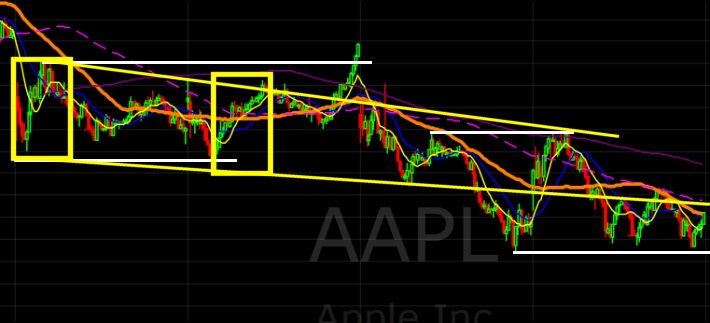
Let’s see what happens if we take this concept (Which we call “Market Geometry”) one step further…
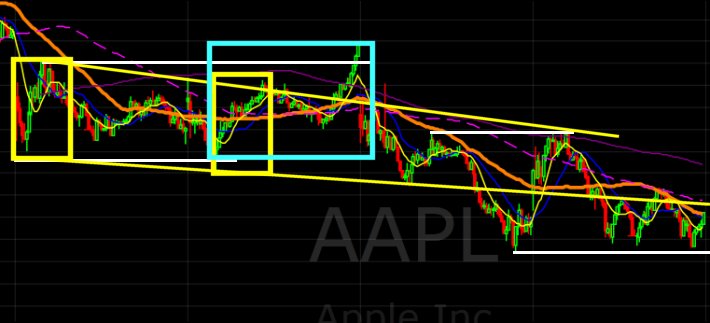
I’ll draw a box on the bigger wave that formed once trend line resistance was broken and the price rallied up to test the chart support level we discussed earlier…
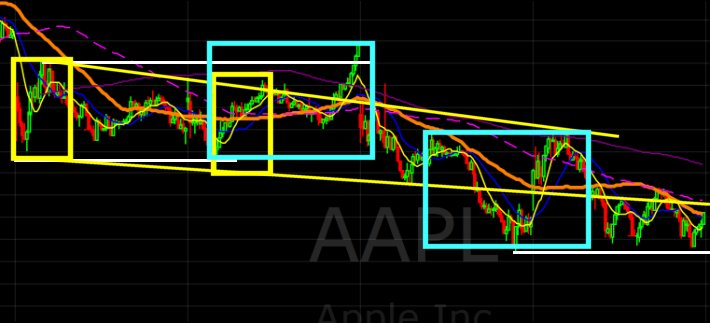
Yes, you guessed it!
This new level of volatility has strong predictive value when projected into the future!
Market geometry can be used to project areas where profit should be taken, and when a market geometry box lines up with an area of support or resistance, it dramatically increases the odds for a sharp reversal in that area…
See how the top of the second blue box lines right up with trend line resistance from before?
That was a high probability reversal point, and a most attracting trading opportunity!
So, hopefully with this set of examples I have permanently banished any questions in your mind that…
1: The markets are random…Clearly they are NOT!
2: Trading is a socially acceptable form of gambling…How can it be a gamble to take a trade when you can predict with consistency and accuracy where the market is likely to reverse, and where it is likely to go next?
3: You can’t time the markets…Well, we just did!
And we predict prices consistently using tools just like these day in and day out to produce reliable and more importantly repeatable profits in any of the world’s financial markets!