
They Say You Can’t Time The Markets…
They say that the market is a random walk…
They are DEAD WRONG!
Because they forget why markets move…
Why they go up on some days, and down on others…
They pay lip service to the forces of supply and demand, but don’t seem to realize that these forces ARE the fundamentals in any market.
Always amazing to see the basic truth that so many miss…
You see…
There are only two ways a market can move:
1: More buyers than sellers/More sellers than buyers
2: An absence of buyers or sellers
When you have more buyers than sellers the market will “grind” and wiggle higher in an orderly manner.
These trends build power and strength, and can offer the best reward/risk ratios.
When a market moves into an area where there is an absence of buying or selling, it will tend to “jump” quickly and violently through that “air pocket” as price seeks areas where more orders are clustered…
Because…
The dirty little secret is…
Most market participants don’t actually care that much about where price goes, as they make the bulk of their money on transaction fees, not capital gains!
Once you understand this truth, it changes your perspective on price forecasting and analysis…
Rather than trying to guess where the price will go next…
You must look for where the market COULD go which will pay these institutional traders as many transaction fees as possible!
In the following example, let's look at a trade opportunity that harnesses technical analysis and the forces that style of trading produces in terms of supply/demand.
This example could well have been based on fundamentals, seasonality, news, market sentiment, or any other form of analysis...
(All of which are taken into account in our proprietary in-house analysis and forecasting model)
Here we have a market that is in balance…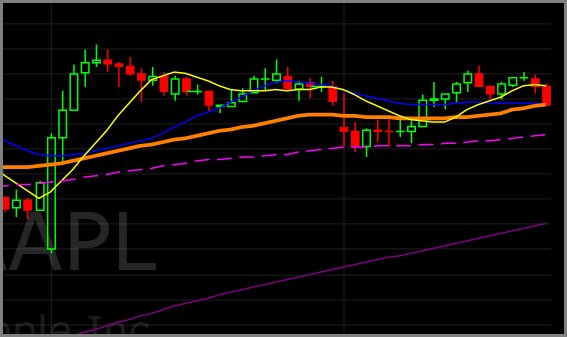
Buyers and sellers have been equally represented and price has been unable to trend.
From a traditional standpoint, this is a “dead market” and it offers little profit potential…
However, if we look at the liquidity pools that are likely to exist in this stock, we can see that there is likely a big pool of buyers clustered around the 20sma (Blue line) and the 50sma (Orange line).
Should that support level be broken, there is no real technical reason for any traders to buy until price drops down to test the 100sma (Pink dotted line)…
Then, there is likely to be a cluster of stop loss orders set just below that as the last swing low…
Why???
Because traditional technical trading has very clear and well known “rules”, and one of those is that when you enter into a pullback trade, you set your protective stop loss orders below the low of the pullback…
Now think about the shift in perspective that gives us?
We don’t care what stock this is…
We don’t care what timeframe this chart is showing…
We don’t care what the CEO is doing, or what their dividend yield is…
AND…
The best part is that we don’t have to GUESS about anything!
We KNOW that the technical traders will be clustered in these zones…
We KNOW that if the support level is broken, the odds are extremely high for price to drop down and test that lower pool of liquidity…
Knowing your market sounds like something a business would do right?
Well…
Your trading and investing SHOULD be treated like a business…
You should eliminate the gamble where you hope something will work out…
And replace it with data points that are reliable and repeatable…
So that you KNOW what your odds for success are!
In this case we KNOW a lot, and can structure a trade that will pay us well as we capture just a little piece of predictable movement.
All businesses have something they call “margin”…
This is the difference between what it costs them to buy or produce something, and what they can sell it for.
Trading is no different…
We demand a minimum margin of 100% for every trade we take…
If we are going to put $1 at risk in the markets, we want to know that if the trade reaches a successful outcome, we will get at least $1 in profit.
More is better…
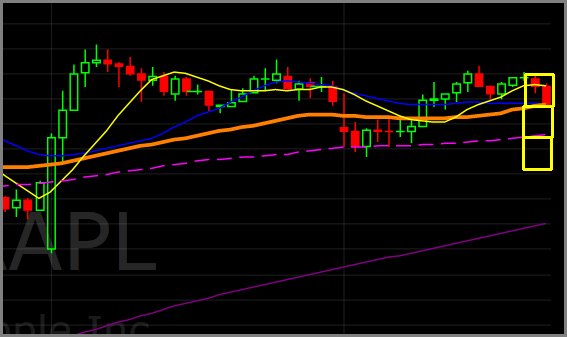
In this example, based on a technical analysis type setup, price can do one of two things…
It can break support and reach down to test the next available liquidity pool…
It can bounce away from support and break out above the last swing high…
This sets up a clear risk management zone as drawn out on the chart above…
Notice how the risk we would assume in this trade offers 100% margin if it simply tests the 100sma?
And what’s best…
The 200% margin level is likely to be hit easily if things begin to melt down.
This is a trade worth taking…
And a little piece of predictable movement based on KNOWN quantities (Trader’s technical behaviors)…
That MOST TRADERS would not even know exists!
Let’s see what happens…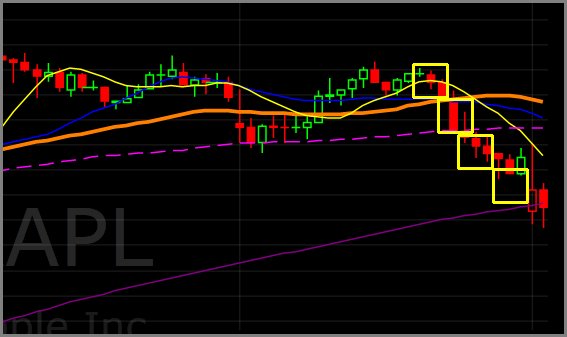
The odds analysis was correct…
This market was able to break the support level and thus trigger us into this trade…
The next support level was tested and broken as well…
In the end, the market moved down to the support offered by the 200sma (Purple line) and that was a logical place to take profits with a 300% mark up!
If you risked $1, you made $3 in profits…
If you risked 1%, you made 3% in profits…
And in this stock (Apple Inc.) you had plenty of liquidity to execute a trade at any risk level, from $100/$100,000!
Imagine if Amazon had the chance to sell items for $100,000 at a 300% mark-up???
They don’t…
As a trader or active investor in the markets…
You do!